
“Winners continue to win.”
1. The Quantitative Global Momentum Philosophy
Momentum investing is simply buying those stocks that have appreciated most relative to other stocks in a given universe. Moreover, when it comes to the “momentum” (formerly called “relative strength price momentum”) value investors tend to scoff at the idea that only the price of a stock could be used as a basis for investment. However, while we consider ourselves diehard value investors, we also consider ourselves evidence-based investors first and foremost.
Eugene Fama, the 2014 co-recipient of the Nobel Prize in Economics and father of the efficient market hypothesis, and his equally well-credentialed co-author, Ken French, have summarized the academic research on momentum as follows [ii]:
“The premier anomaly is momentum.”
When the greatest empirical finance researchers suggest momentum is the leading academic anomaly, we take note. Fama and French make this statement because the empirical research on the momentum effect is compelling. For example, academic researchers have examined stock data going back over 200 years and identified a significant and robust historical performance record [iii]. Momentum is well grounded, historically [iv]. Of course, for a strategy to provide persistent above average returns we need it to be steeped in a behavioural bias, and not simply possess a compelling backtest. We believe, the above average returns to momentum will persist because they are driven by innate human bias [v].
Human Behaviour & Quantitative Tools
Despite widespread knowledge that value and momentum generate higher returns over the long-haul, both strategies have continued to beat the market. How is this possible? The answer relates to a fundamental truth: human beings behave irrationally. We follow an evolutionary mindset that focuses on survival, not return optimization. While we are unlikely to ever eliminate our survival instincts, we can minimize their impact by employing quantitative tools.
“Quantitative,” is often considered to be an opaque mathematical black art, only practiced by Ivory Tower academics and supercomputers. However, quantitative (or systematic) processes are merely tools that value investors can use to minimize their “survival” instincts when investing. Quantitative tools serve two purposes: 1) protect us from our own behavioural errors, and 2) exploit the behavioural errors of others. These tools do not need to be complex, but they do need to be systematic. The research demonstrates that simple, systematic processes outperform human “experts” [vii]. The inability of human beings to robustly outperform simple systematic processes also holds true for investing, just as it holds true for most other fields [viii].
Much of the analysis conducted by investors - reading financial statements, interpreting past trends, and assessing relative valuations - can be done faster, more effectively, and across a wider swath of securities via a systematic process. Investors argue that instinct and experience add value in the stock-selection process, but the evidence does not support this interpretation. Why? When investors respond to non-quantitative signals (e.g., the latest headlines, their expert friend’s opinion, their interpretation of a price pattern etc.), they unconsciously introduce cognitive biases into their investment process. These biases lead to predictable underperformance. The Quantitative Global Momentum Investing Philosophy is best suited for value investors who can acknowledge their own fallibility. Granted, the approach is not infallible, and should always be questioned; however, the approach seeks to provide the following: a systematic, evidence-based, momentum focused investment strategy that is built to beat behavioural bias [ix].
2. The Quantitative Global Momentum Process
We distilled our entire process into four core steps:

Step 1 - Identify Universe
We consider the global stock universe with a focus on developed markets, but candidates in some emerging markets are also considered.
Step 2 - Generic Composite Momentum Screen
To a value investor buying a stock because it has gone up in price sounds like an idea that runs the continuum from a masochistic desire to destroy capital to outright lunacy! The ever-mounting body of evidence, however, suggests that such a strategy belongs in the domain of the rational empiricist.
Momentum can be calculated in numerous ways; while some periods of measurement are additive to returns, others are outright destructive and need to be avoided.
Academic research for three different look-back periods is summarized below:
-
Short-Term Momentum (1-month) - exhibits a reversal in returns [xvi]
-
Long-Term Momentum (3 to 5 years) - exhibits a reversal in returns [xvii]
-
Intermediate-Term Momentum (6-12 months) - exhibits a continuation in returns [xviii]
In short, both short-term and long-term momentum signal a future reversal in returns. In other words, one can expect these stocks to underperform. However, intermediate-term momentum provides a continuation of returns - these stocks tend to outperform and are the subject of our focus.
The momentum look-back we use for our generic composite momentum screen is calculated using the cumulative 6, 9 and 12-month past returns, excluding the most recent month respectively. We exclude the most recent month as 1-month periods exhibit a reversal in returns; therefore, excluding the most recent month minimizes the effect of short-term momentum reversal. Strictly speaking, we calculate momentum using the cumulative returns over 5, 8 and 11 months respectively. The momentum scores stemming from each of these look-back periods are ranked and subsequently equally weighted. Applying a composite momentum metric (as opposed to a single momentum metric) aims at reducing the likelihood of a stock with a 'false momentum signal' from entering the portfolio.
Wesley Gray and Jack Vogel in their book, “Quantitative Momentum” [xix] examine how the momentum portfolios have performed. Specifically, they analyse the returns to the value-weighted top and bottom decile momentum portfolios using only 12_2 momentum from 1-Jan-1927 to 31-Dec-2014 rebalanced monthly.
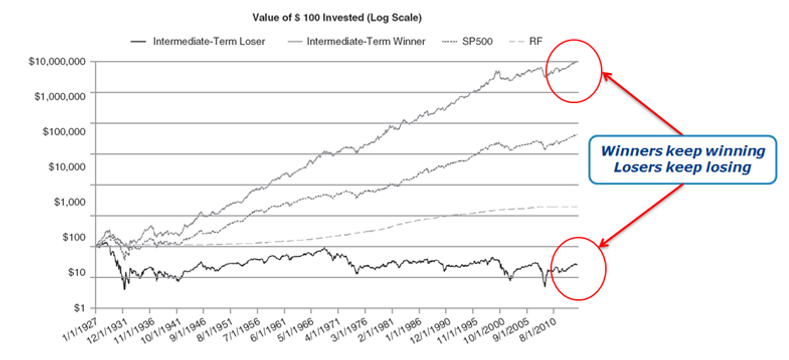
Clearly from their analysis we can see that buying the highest momentum stocks (and rebalancing monthly) over the time period tested worked remarkably well.
To illustrate the importance of rebalancing momentum we provide an extract from the research piece “How Portfolio Construction Affects Momentum Funds” [xx]:

Clearly, there is a relationship between the holding period (the number of firms) and returns. The holding period is important; keeping the number of firms constant, the lower the holding period, the higher the CAGR. Such is the decay in momentum that a 12-month holding period resulted in return below that of the overall universe for a 50-stock portfolio. However, due to the impact of commissions (assuming 0.1% per trade) a 3-month rebalance represents the optimal rebalancing period; therefore, this is the period we implement in our process.
At this point in the process we retain the 10% of stocks with the highest momentum:

Step 3 - Momentum Quality Ranking
“All momentum is not created equal”
Having identified our universe and determined which of those stocks demonstrate the greatest generic composite momentum we now rank our remaining candidates based on the “quality” of their momentum.
But what is “quality” momentum and how does it differ from the “generic” momentum we identified in the previous step?
Jack Vogel of Alpha Architect explains quality momentum as follows:
The details for calculating momentum quality are complex, but the intuition is simple. Consider two hypothetical momentum stocks: Stock A is a box store, Stock B is a biotechnology company, and both companies have a 200% return over the past 12 months. However, assume A and B have vastly different paths to 200% returns.
-
Buzzing Biotech: Stock B’s returns were 0% for 11 months, but just recently Stock B was granted an FDA approval for a new drug and the stock shot up 200%.
-
Boring BigBox Store: Stock A has returned 0.80% each day, on average, for the past 250 days, and has generated a 200% return.
Stock A and Stock B are both considered momentum stocks, but Buzzing Biotech’s path is much different from Boring BigBox’s path. So-called “path dependency” matters, if momentum is driven by an investor bias referred to as “limited attention.” For example, Buzzing Biotech’s FDA approval will likely be covered by the media and be highly available to investors, thus rapidly driving the company’s price to efficient levels. However, Boring BigBox is delivering news that is consistently better than market expectations over a longer period, and because the attention to Boring BigBox is limited, this good news is slow to be incorporated into market prices. Below we graphically depict a hypothetical example of 2 “high” momentum stocks.
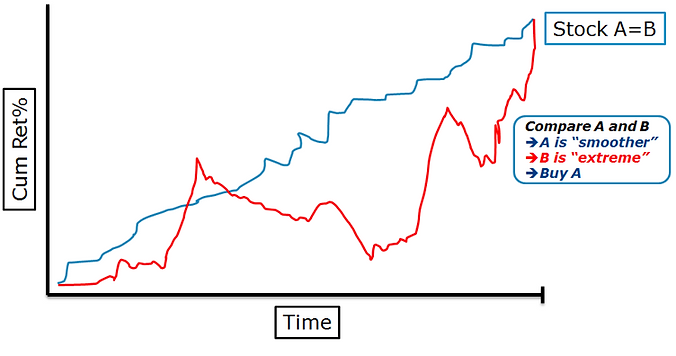
Although testing the “limited attention” hypothesis in the context of momentum is challenging, we’re lucky that finance professors have been hard at work. In a 2014 paper titled, “Frog-in-the-Pan: Continuous Information and Momentum,” Zhi Da, Umit Gurun, and Mith Awarachka find that high momentum firms with smooth, or “high-quality” momentum, tend to do better than those firms with choppy low-quality momentum [xxi].
In this step of the process we rank the remaining stocks on the quality of their momentum:

Step 4 - Construct & Manage
Steps 1 to 3 systematically seek to identify the highest quality momentum stocks. However, we still need to specify how we construct and manage the portfolio.
The components of portfolio construction and management are addressed below:
-
Defining “Risk” - we define risk as the probability of the permanent loss of capital rather than volatility or any variant thereof. The permanent loss of capital when investing in equities is possible. While it is said that finance suffers from “physics envy”, we think an adaption of the law of conservation of energy applies to investing; “risk cannot be destroyed, only changed from one form to another”.
-
Currency Risk - constructing a global equity portfolio creates exposure to foreign currencies (we usually convert the base currency into the local currency when investing in stocks denominated in a non-base currency), and we do not hedge against it. This is primarily because we do not necessarily see foreign currency fluctuations as a risk; on the contrary, we see hedging foreign currency exposure as creating a “concentration risk” in a single currency. However, we might consider hedging currency exposure if, for example, a currency stretched far from its 5-year average relative to other currencies, or some other extraordinary situation presented itself.
-
Weighting - we equally weight our holdings. In a 2009 study by DeMiguel, Garlappi, and Uppal, “Optimal Versus Naïve Diversification,” the authors found that a basic equal-weight asset allocation model beats modern portfolio theory and 13 other even more complex strategies [xxii]. We heed the lesson that “simplicity trumps complexity” and consequently we simply aim to “equal weight” our holdings.
-
Number of holdings - we generally hold 20 to 25 stocks in equal weight (at cost). We accept that investing in stocks can result in the permanent loss of capital. Accordingly, one divided the number of holdings reflects that proportion of capital we accept could be lost in any given stock. From an academic perspective, Elton and Gruber’s 1977 paper, “Risk Reduction and Portfolio Size: An Analytical Solution” draws the conclusion that the bulk of “diversification benefit” is achieved with just 8 stocks and becomes negligible beyond 50 stocks [xxiii]. In addition, table 4.2 in the book “Concentrated Investing: Strategies of the World's Greatest Concentrated Value Investors” [xxiv], by Allen C. Benello, Michael van Biema, and Tobias E. Carlisle it is demonstrated that over time a relatively small sample, when picked at random can replicate the returns of a much larger population; the conclusion being one need not own “too many” stocks to achieve the “benefit of diversification”.
-
Rebalancing - following entry into the portfolio, stocks are held for a minimum of 3 months. In the event that a stock remains in the portfolio after an initial 3 month hold it is reassessed on a monthly basis thereafter. Furthermore, in an attempt to reduce “whipsaws” (i.e., stocks bouncing in and out of the portfolio resulting in unnecessary turnover) the “momentum” parameters for retaining a stock are marginally extended. As addressed in an earlier section it is well known the momentum works best when rebalanced monthly. Nonetheless, due to the impact of commissions a 3-month rebalance represents the optimal rebalancing period; therefore, this is the period we implement in our process.
-
Final checks – in addition to that outlined above, prior to making the decision to invest, or otherwise, we analyse several items, including, but not limited to: insider transactions, short interest, audit reports, recent announcements etc. in an attempt to ensure the probability of incurring a permanent loss of capital is further reduced.
The complete Quantitative Global Momentum algorithm is as follows:

3. Conclusion - “Simple, but not easy”
“Investing is simple, but not easy” (Warren Buffett)
Investing in a momentum strategy is theoretically “simple” but certainly not “easy”. However, the empirical evidence is clear, in aggregate they greatly outperform the market over time. Moreover, even when enhancing their return profile by adding a momentum quality overlay to a portfolio of stocks with strong momentum there are times when such a strategy may lag the market. Without a time horizon of at least 5 years an investor may not be “in the game” long enough to capture the rewards of the Quantitative Value with Momentum process; “no pain, no premium”.
The strategy requires an individual or fund to expend considerable resources to construct, maintain and manage such a system. Nonetheless, for the enterprising investor, with a sufficient time horizon, history tells us that the Quantitative Global Momentum strategy will provide ample reward.
References
see "Reference" section of the Quantitative Value and Momentum strategy. As the Quantitative Global Momentum is largely contained within the Quantitative Value with Momentum strategy the references for that strategy remain valid here.
Disclaimer
We are not registered investment advisors. This material has been provided for informational purposes only and should not be considered as investment advice or a recommendation of any particular security, strategy or investment product. Information contained herein has been obtained from sources believed to be reliable, but not guaranteed.